How to Check Google Analytics Data On Dashboard
Check Google Analytics Data On Dashboard

1) How to check Performance Report By Month
2) SEO Performance
3) Website Stats (GA4)
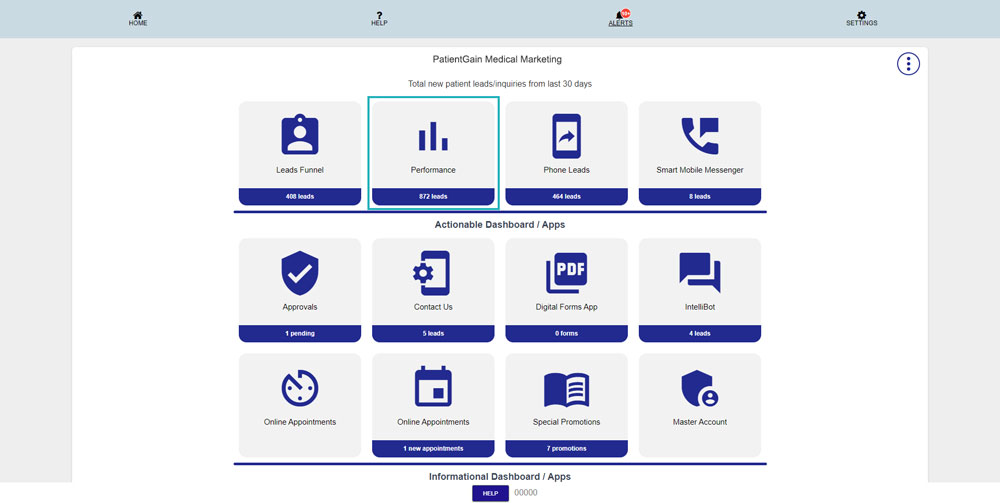
First, Login to your HIPAA Server Dashboard and then click on the “Performance” app.
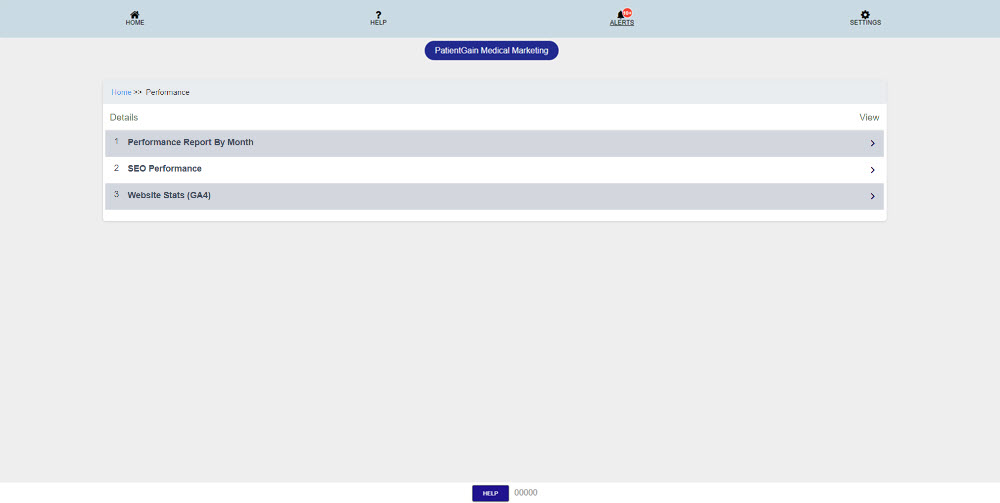
Now on Performance Page – You will see the following options:
- How to check Performance Report By Month
- SEO Performance
- Website Stats (GA4)
Performance Report By Month:
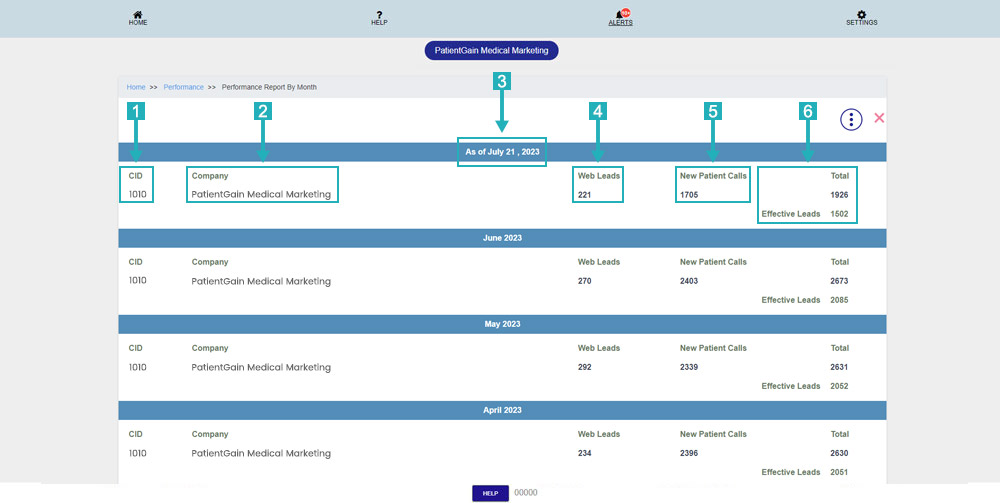
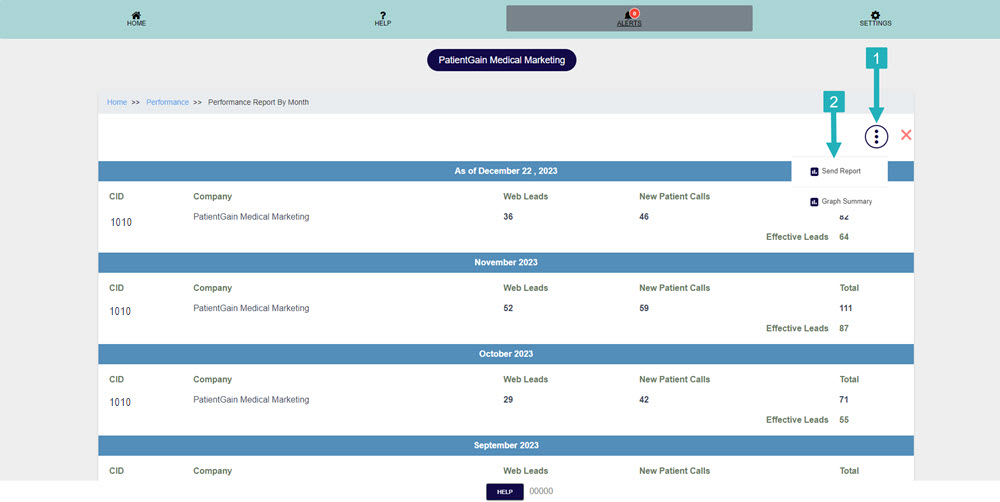
On this page – You will see the details of all your leads in monthly view:
- Company ID: This ID is assign by PatientGain’s Team to each customer.
- Company Name or Location Name: The name of the Company or if you have multiple locations then multiple names will be shown here.
- Month and Year: Name of the month and year display on top of each months details.
- Web Leads: This area shows the total number of leads you have captured from you website in all the apps.
- Phone Leads: This area shows the total number of phone leads you have captured using our Call Tracking number.
- Total Number: This area shows the total number of web leads and phone leads for this month.
Click on the menu button and then click on the “Send Report” option.
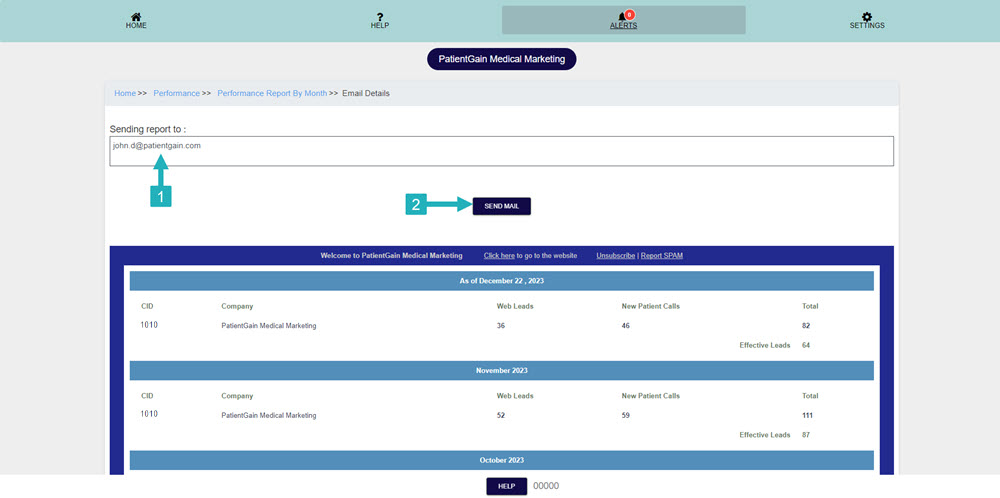
From here, please add your email here and click on the Send Mail button to the SEO Performance report by month.
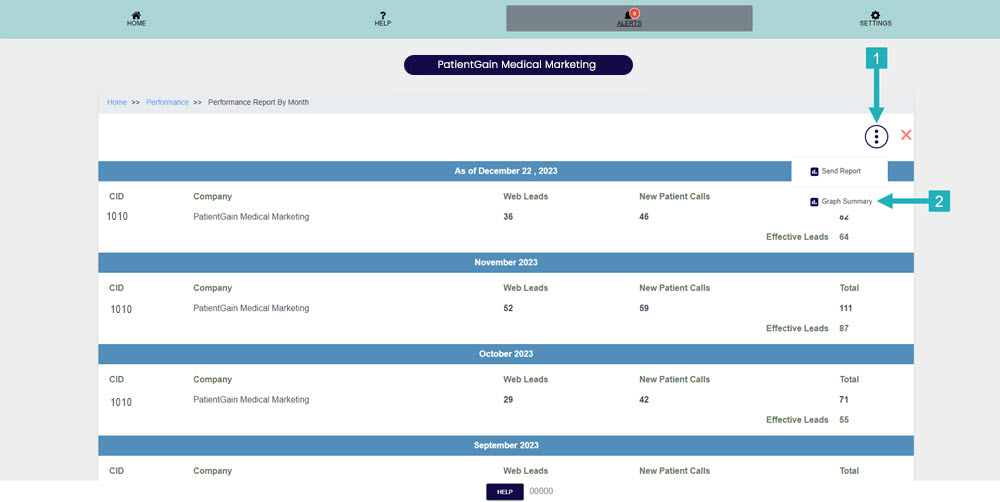
In order to check the Graph summary please click on the menu button and then click on the “Graph Summary” option.
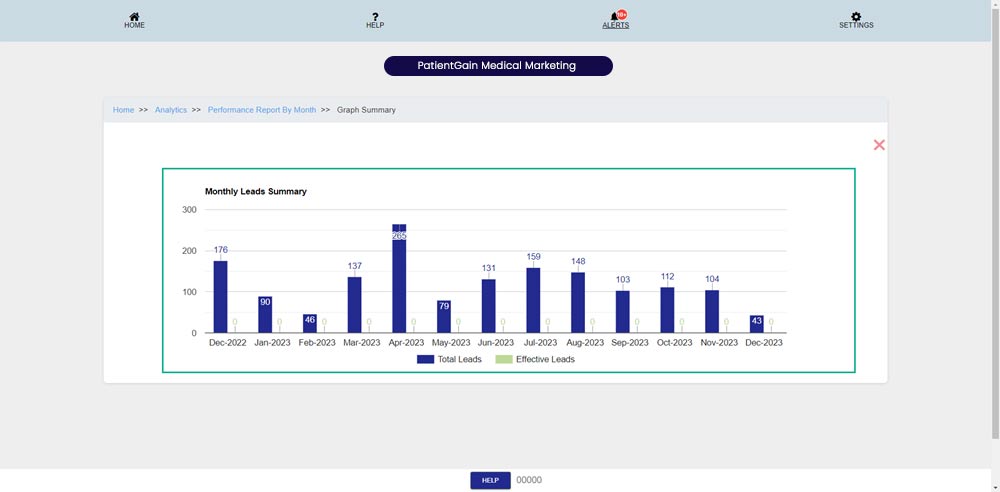
From here you can see the Graph Summary of SEO Performance report by month.
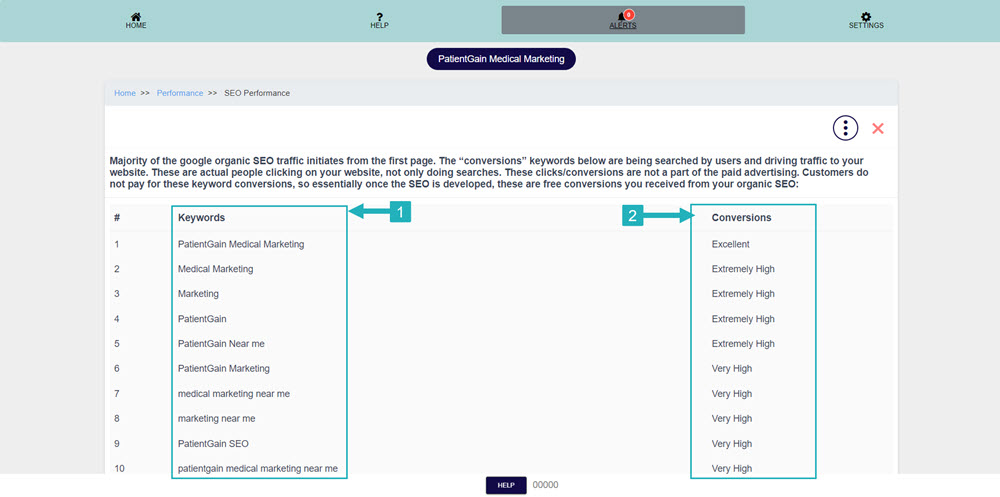
SEO Performance:
- Keywords: This area shows the traffic keywords in your site.
- Conversions: This area shows the number of conversions on each keyword.
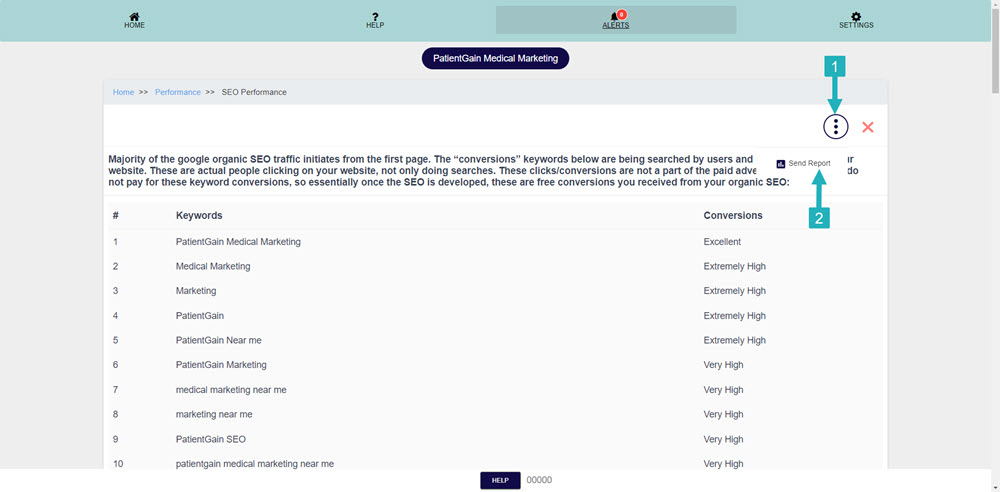
Click on the menu button then click on the “Send Report” option.
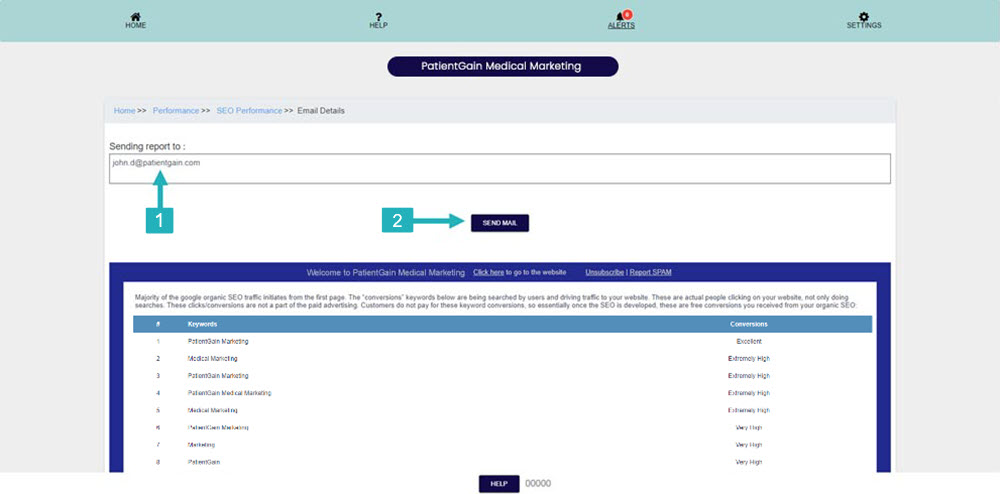
From here please add your email and click on the Send Mail button to send the SEO Performance report.
Website Stats (GA4):
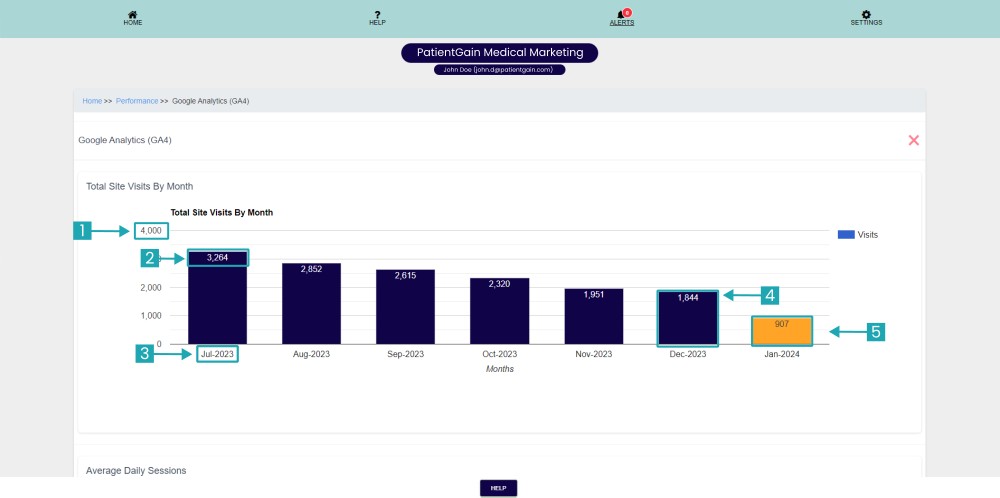
On this page – You will see a Visual Graph of each month website leads. Each bar represents monthly leads for each month.
- This number shows the number of highest web leads you have received this.
- This number shows the number of total leads you have received on that month.
- Name of the Month and Year.
- Blue bars represent the web leads data of the previous month.
- Orange bars represents the web leads data for the current month.
Note: Each bar shows the combine data of Web leads and Website Traffic.
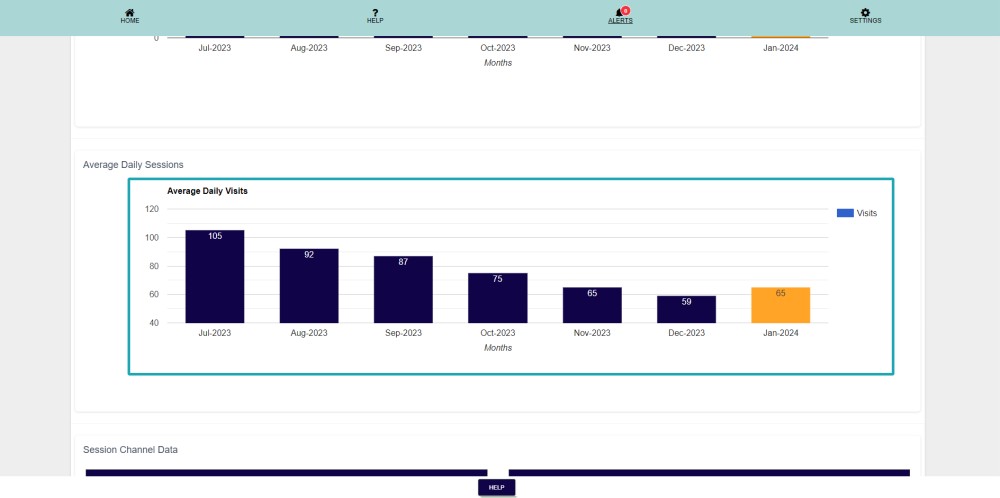
On this section you can see Average Daily Sessions.
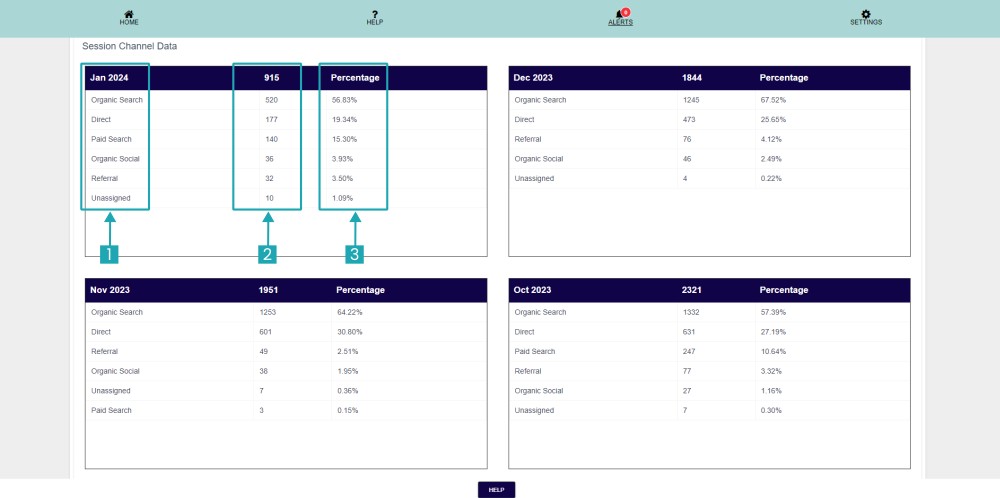
On this section you can see Session Channel Data.
- This number shows your Search result names from different source.
- This number shows the number of total leads you have received.
- This number shows the percentage of your leads.
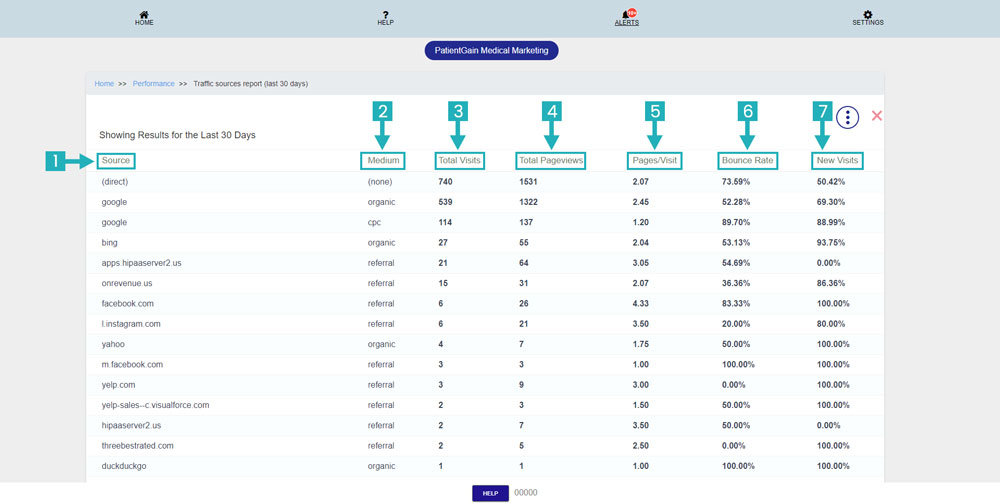
Traffic Sources Report (last 30 days):
On this page – You will see the report of all the website traffic from different sources:
- Source: This area shows the name of the source from where traffic is coming to your site (for e.g. Google, Facebook, etc)
- Medium: This area shows if the traffic was organic/referral or direct.
- Total Visits: This area show the total number of website traffic you have received from that source.
- Total Pageviews: This area shows the total number of page views you have received from that source. So if a person comes to your website how many pages he visit from that source.
- Pages/Visit: This area shows the total percentage of the page visits you have captured from that source.
- Bounce Rate: This area defines the percentage of the time person spent on your website from that source (Lower is better).
- New Visits: This area shows the total number of new users you have received from that source.
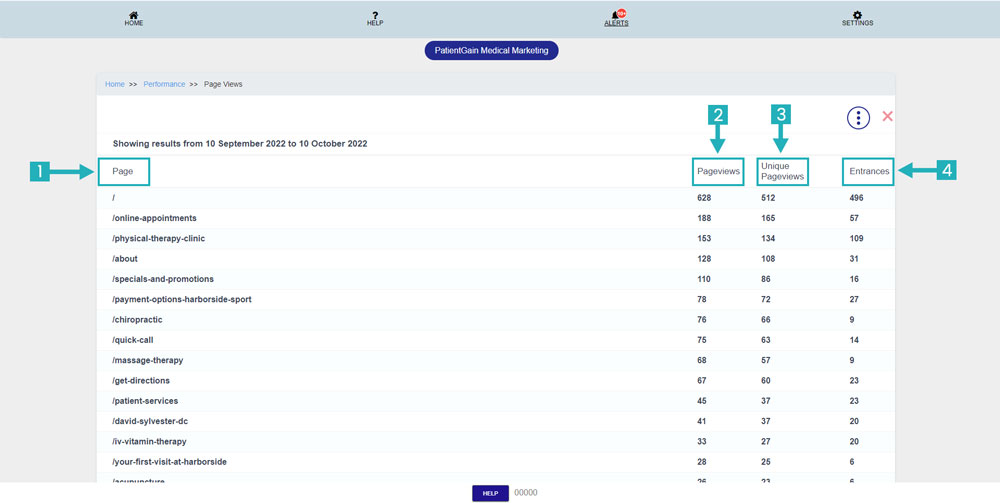
Page Views:
On this page – You will see the detailed report of your website traffic according to each page:
- Page: This are shows the URL/Slug of the page.
- Pageviews: This area shows the total number of visits you have received on that page.
- Unique Views: This area shows the total number of new users you have received on that page.
- Entrances: This area shows the total number of users who started their session on your website from this page.
